Digital Chart Recorder
This Chart Recorder solution is a ready-to-use solution for customers looking for an out of the box Chart Recorder / Datalogger. The Chart Recorder monitors 4-20 mA and/or PT100 RTD signals from the field, which can then be scaled into a displayed reading and data point. The data is presented in several manners ranging from graph-centric to numeral-centric. These scaled values also have an engineering units field. All of these visual options are selectable by the operator.
- four retentive, definable scaling trend objects can record and display 4-20mA or PT100 RTDs
- large, high quality, color touchscreen with user-friendly controls
- programmable alarms: high, warning high, warning low, and low with notifications via email, visual, etc.
- Modbus TCP/IP access of data points from other devices or software packages
Product Documents
Description
- UL508 Digital Chart Recorder package
- 10″ touchscreen controls with 1024×600 display
- 4 retentive trend objects that can record and display either 4-20mA or RTD (-50 to 200˚C) with definable scaling
- configurable alarm points of alarm high, warning high, warning low, and alarm low with configurable alarm notifications
- can alarm using visual and e-mail notifications
- networking capabilities:
- email for daily log files sent
- email for Warnings and Alarms
- Modbus TCP/IP access of data points from other devices or software packages
- FTP access for datalog file retrieval
- WebMI access for remote monitoring
This Digital Chart Recorder, from Horner Solutions, is a preprogrammed solution that helps users visualize and record data for whatever the process may be. Users can easily change between 4-20 mA or RTD and scale them to keep track of temperature, flow rate, pH, pressure, level, humidity, or any other analog sensor inputs in the process. Each signal trends and captures in files on MicroSD. These files save as comma separated variable (CSV) files.
Operators can configure automatic e-mails to easily notify users of alarm conditions or to provide daily log reports. All values are datalogged locally at specified intervals and easily available for reporting.
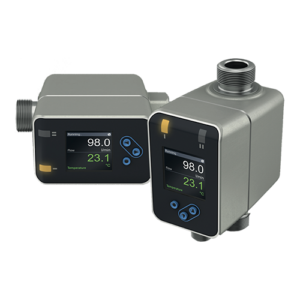
All-in-One Datalogger for Water Monitoring
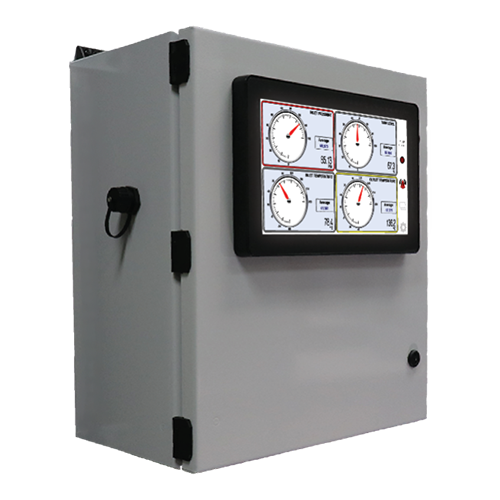
Each display showing readings of four positions, one for each signal. Flexible configuration allows for any analog channel to route to any of the four positions. It allows for rearrangement of the order on the screen without rewiring. Additionally, it allows use for one signal in multiple scales, e.g. both ˚C and ˚F temperatures from the same RTD input.
Continuous datalogging is optional. Data writes to Excel-friendly (CSV) files. When enabled, one file daily is made for each of up to 4 enabled signals. Furthermore, all signals log to a single file if no recording is active. Specific recordings, or records, can write separately from continuous recordings. In addition, records may start or stop in several ways: manually, via timer, or RTC schedule.
A record takes over both the “all signals” and the warning / alarms datalog files. A record file, either signal recordings or warning / alarm recordings, may span 2 or more days in one file. Notification of a new Record can be sent via e-mail when the recording is done. Files optionally attach if files remain under 1,000 datalog entries. Moreover, records and all datalog files are retrievable via FTP.
Digital Chart Recorder for Environmental Monitoring
This datalogger is ideal for applications such as wastewater discharge, effluent, and pretreatment monitoring. It can assist with permitting compliance when values need tracking over time. In addition, it provides real-time alerts when a value is out of range.
Direct Discharge
Users can easily configure the Horner Chart Recorder to keep track of water quality standards without the use of additional, costly software or integration.
Pretreatment
Streamline pretreatment reports for online measurements without relying on handwritten notes or cumbersome spreadsheets. The Chart Recorder can track and generate time-stamps on data log reports for necessary process inputs. For example, it’s ideal for tracking pH, flow rates, total suspended solids (TSS), or for any other sensor that is necessary for permitting.
Pump Station, Lift Station (Wastewater), Water Distribution Monitoring (Revenue/Drinking Water)
Remotely monitor, visualize, and track important information with Horner WebMI to supplement or take the place of SCADA systems. WebMI allows remote access to any Chart Recorder with a network connection from any web browser. Track data, configure alarms, and identify potential process upsets before spending resources to check in-person.
Digital Chart Recorder Applications in Process Monitoring
This solution is ideal for applications in process monitoring where several inputs need visualization and local tracking or to be available remotely.
- Trend and record process data such as storage tank levels, temperatures, or other quality measurements. Add an alarm for when material is low or when there is a process upset.
- Add several measurement points to one screen to make it simple for users to gain process insights at one place. It’s much easier than checking several local displays that may be spread out or difficult to reach manually.